

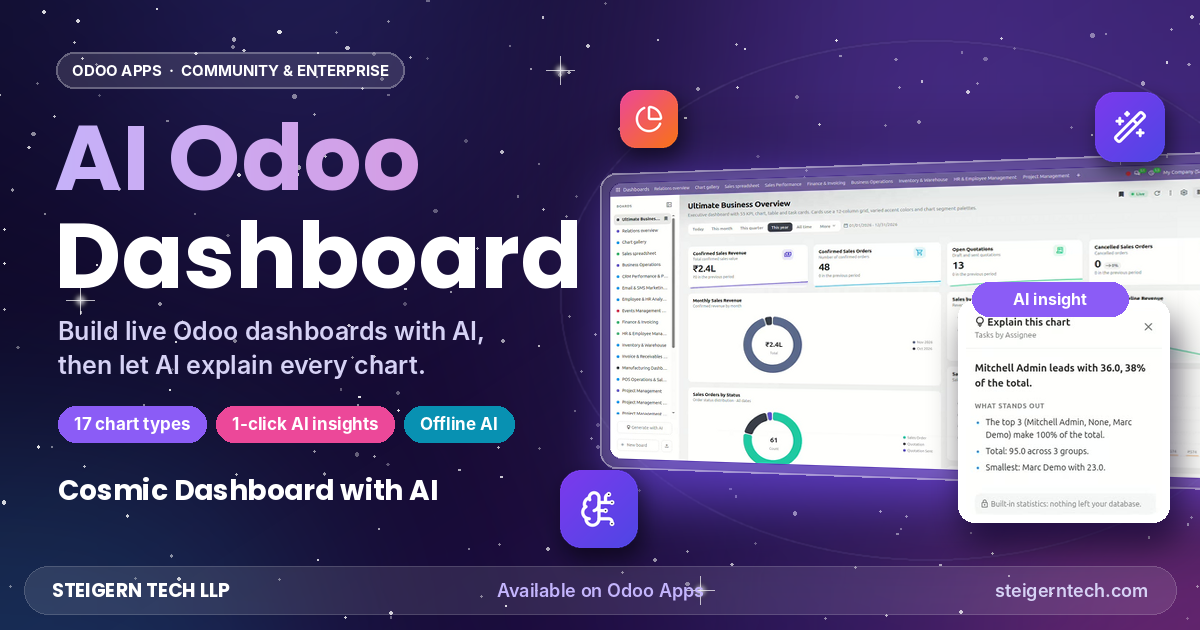
AI Odoo Dashboard: Build Smart Odoo Dashboards with AI
Quick Answer
An AI Odoo dashboard turns your live Odoo data into interactive charts and KPIs, and uses AI to build boards and explain results in plain language. With Cosmic Dashboard with AI by Steigern Tech LLP, you describe the KPIs you need, AI generates the dashboard, and one click on any chart gives you an insight: what stands out, totals and outliers. No code, no external BI tool, and your records stay in Odoo.
Key Takeaways
- ✓ 17 chart and card types: from KPI tiles and funnels to gauges, bullet charts and a choropleth world map.
- ✓ Generate with AI: describe your KPIs in plain English and receive a ready-to-use dashboard of fully editable cards.
- ✓ Explain this chart: one-click AI insights explaining trends, totals, anomalies and outliers.
- ✓ 6 AI provider options: built-in offline engine needing zero API keys, plus OpenAI, Anthropic, Google Gemini, Azure OpenAI, and self-hosted models.
- ✓ Real-time Odoo data: query any standard or custom model, with drill-down to underlying records, 20+ date presets, and exports to Excel, CSV, PDF, and PNG.
- ✓ Compatible with Odoo Community and Enterprise: runs seamlessly on Odoo Online, Odoo.sh, and On-Premise deployments. Get it on Odoo Apps →
What is an AI dashboard in Odoo?
An Odoo dashboard is a central command screen that brings key numbers from across your Odoo apps—such as sales orders, customer invoices, warehouse inventory, CRM leads, or HR employees—together into interactive charts, KPI tiles, and aggregated tables. Instead of navigating across dozens of individual reports or spreadsheets, business owners and department heads can monitor the entire organization at a glance.
An AI Odoo dashboard introduces intelligence directly into that visualization layer. Artificial intelligence can automatically construct comprehensive dashboards from a simple natural language prompt, and analyze charts on demand by explaining what the numbers mean, identifying which metrics changed week-over-week, and surfacing anomalies. This enables rapid board configuration and instantaneous data-driven decisions without requiring dedicated BI engineers.
Why businesses need an AI Odoo dashboard:
- Standard Odoo reports are siloed: Native graph and pivot views are restricted to one model at a time, and building consolidated executive views requires manual report curation.
- External BI tools add friction: Solutions like Microsoft Power BI or Tableau require continuous data synchronization connectors, separate hosting environments, costly per-user licensing fees, and complex ETL pipelines.
- Executives need immediate answers: When revenue dips or lead conversion slows, decision-makers want actionable root causes, not just static bar graphs. AI-powered chart explanations deliver clarity in seconds.
Meet Cosmic Dashboard with AI
Cosmic Dashboard with AI | Odoo Dashboard Builder, KPI & BI Analytics is a native Odoo module engineered by Steigern Tech LLP. It empowers teams to build real-time, interactive dashboards from any Odoo model without writing a single line of code, while leveraging AI to both generate and explain visualizations.
| Detail | Value |
|---|---|
| Developer | Steigern Tech LLP, Ahmedabad, Gujarat, India |
| Technical Name | cosmic_ai_dashboard_stg |
| Supported Editions | Odoo Community & Odoo Enterprise |
| Hosting Options | Odoo Online, Odoo.sh, On-Premise Servers |
| Chart & Card Types | 17 interactive visualization styles |
| AI Providers | 6 (Built-in offline engine, OpenAI, Anthropic, Google Gemini, Azure OpenAI, OpenAI-compatible / local LLMs) |
| Date Filtering Presets | 20+ dynamic date presets plus custom date ranges |
| Export Formats | 4 formats (Excel with native charts, CSV, PDF, and high-res PNG) |
| Access Control Levels | Viewer, User, Administrator |
| Price & Availability | USD 89 (Odoo Apps Store, Nov 2026) |
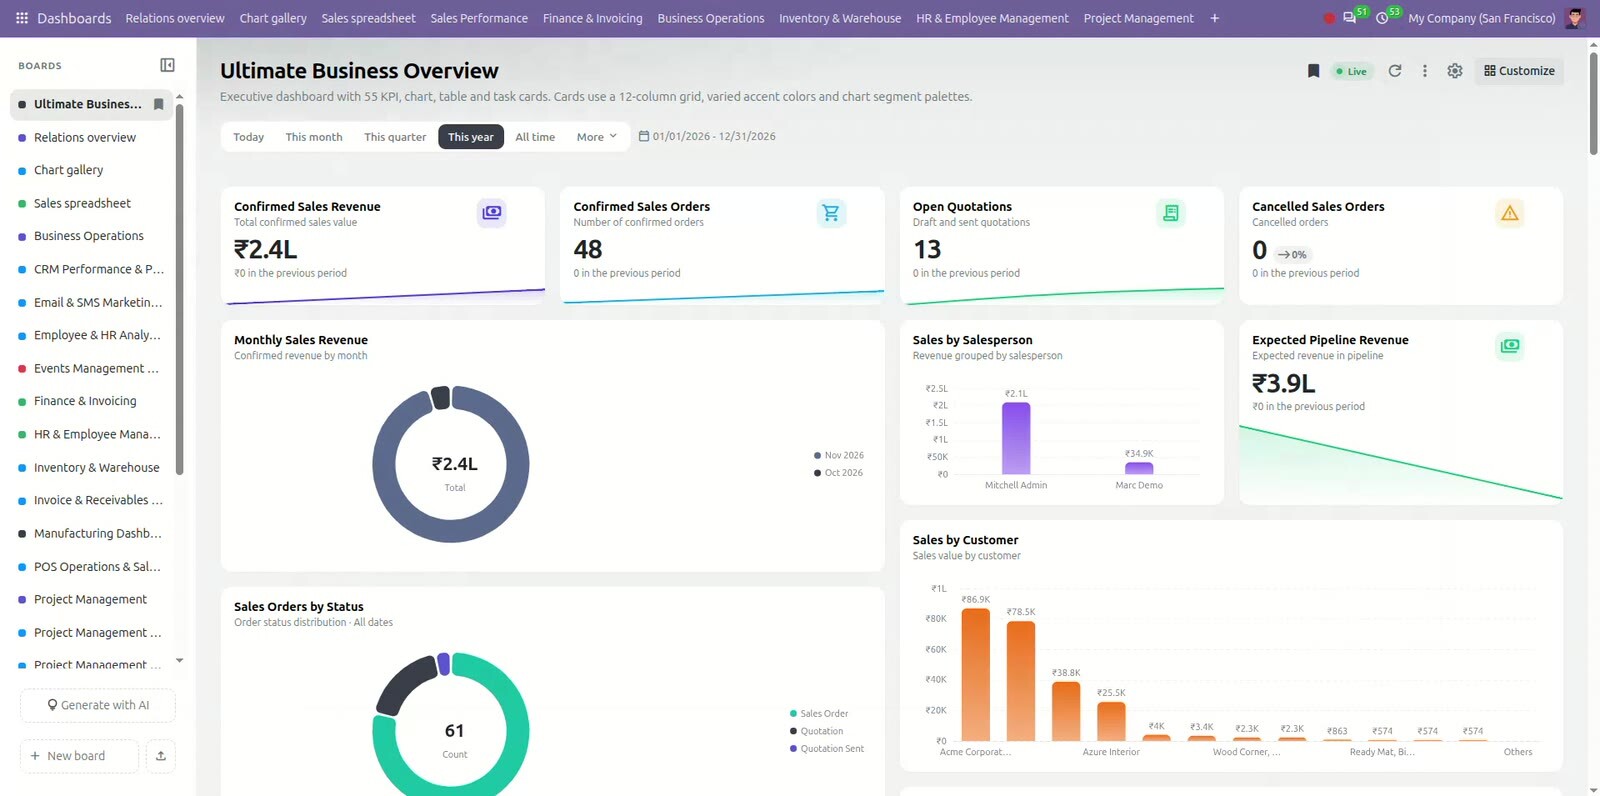
Key features of the AI Odoo dashboard
1. Generate a dashboard with AI
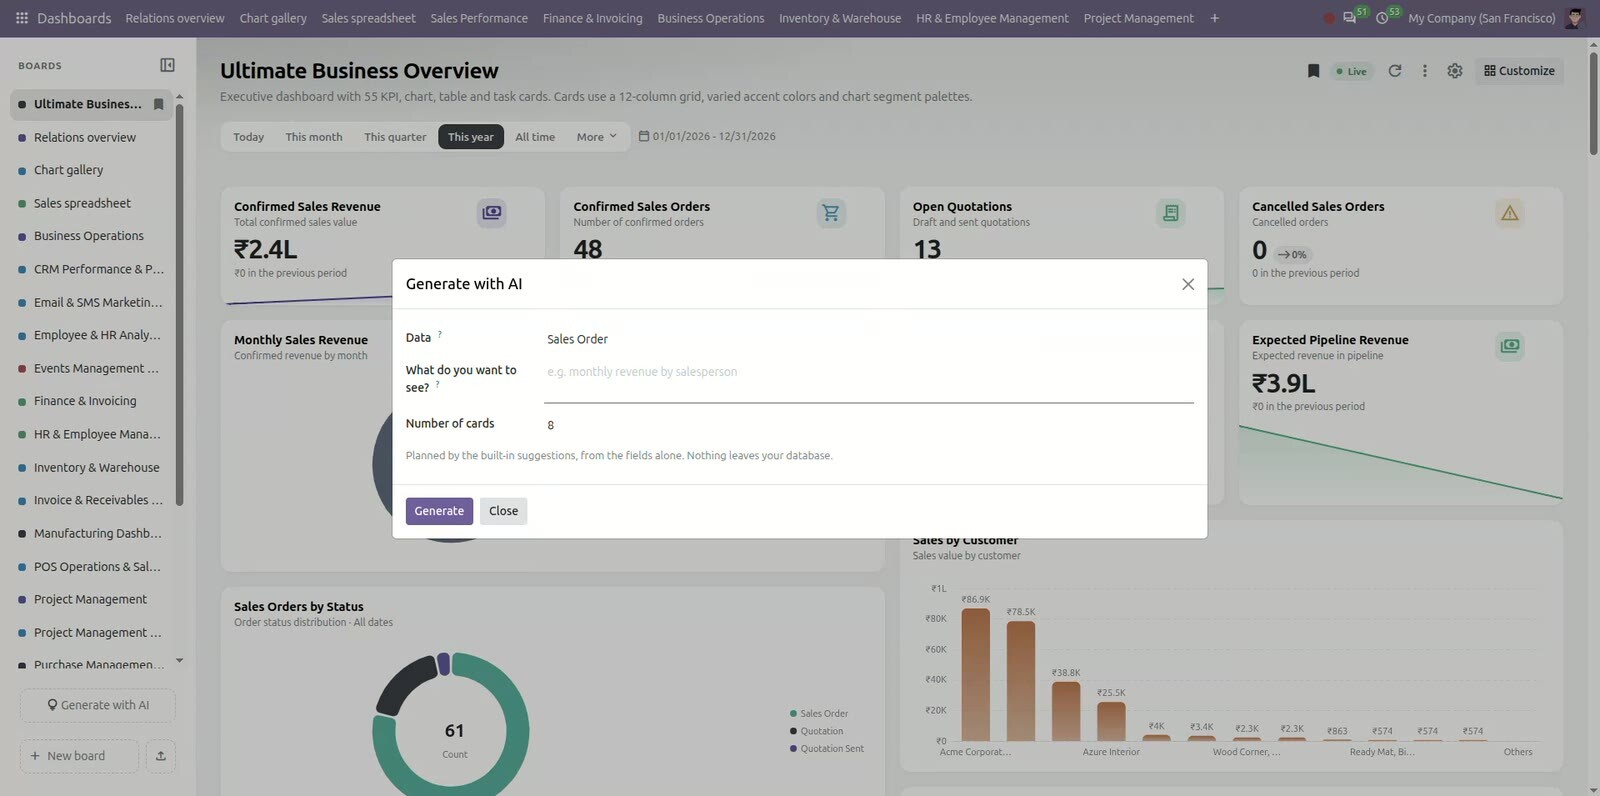
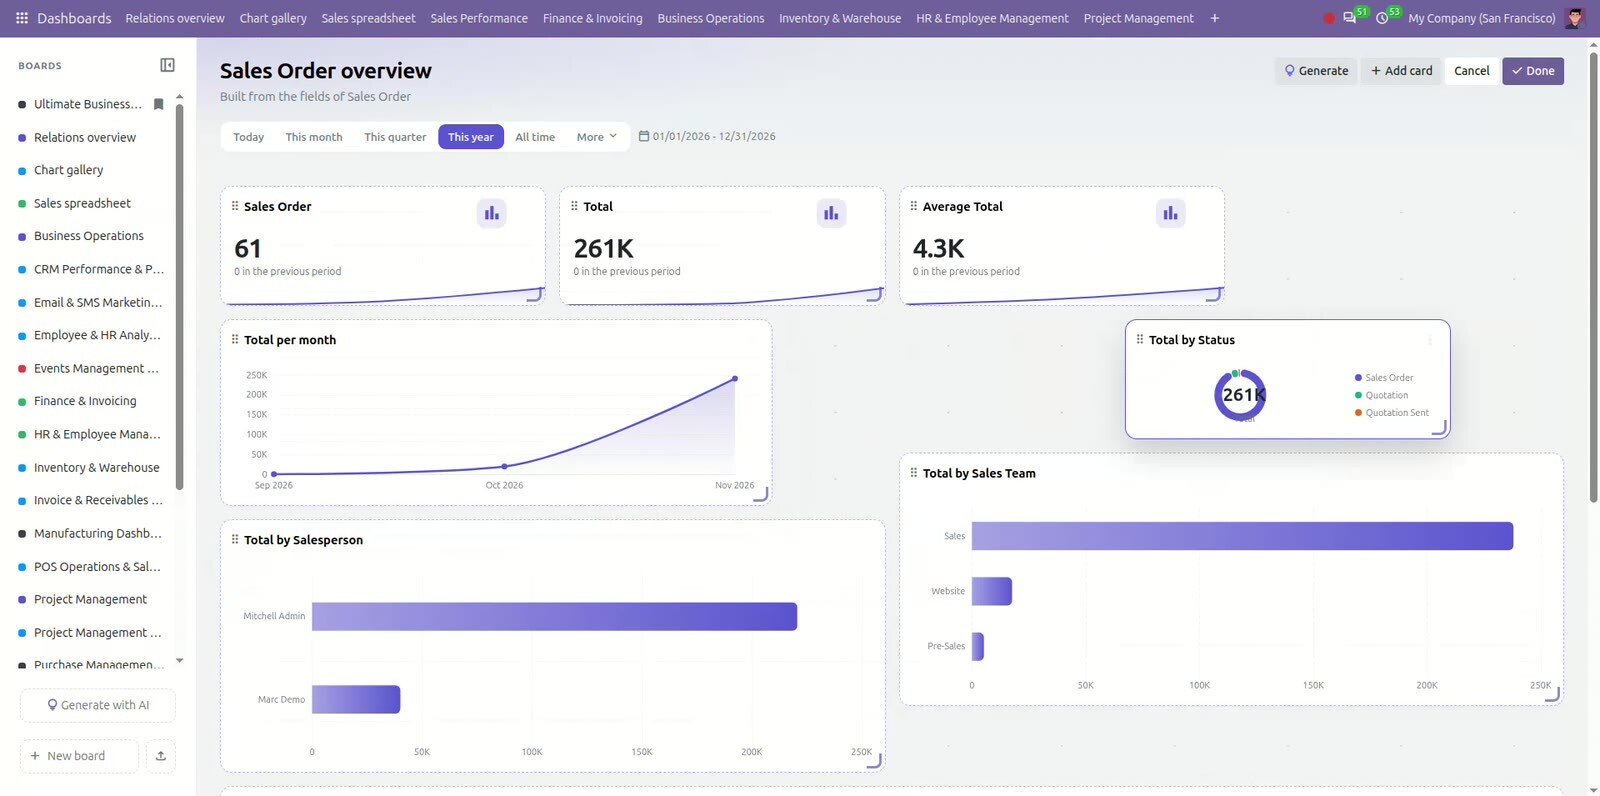
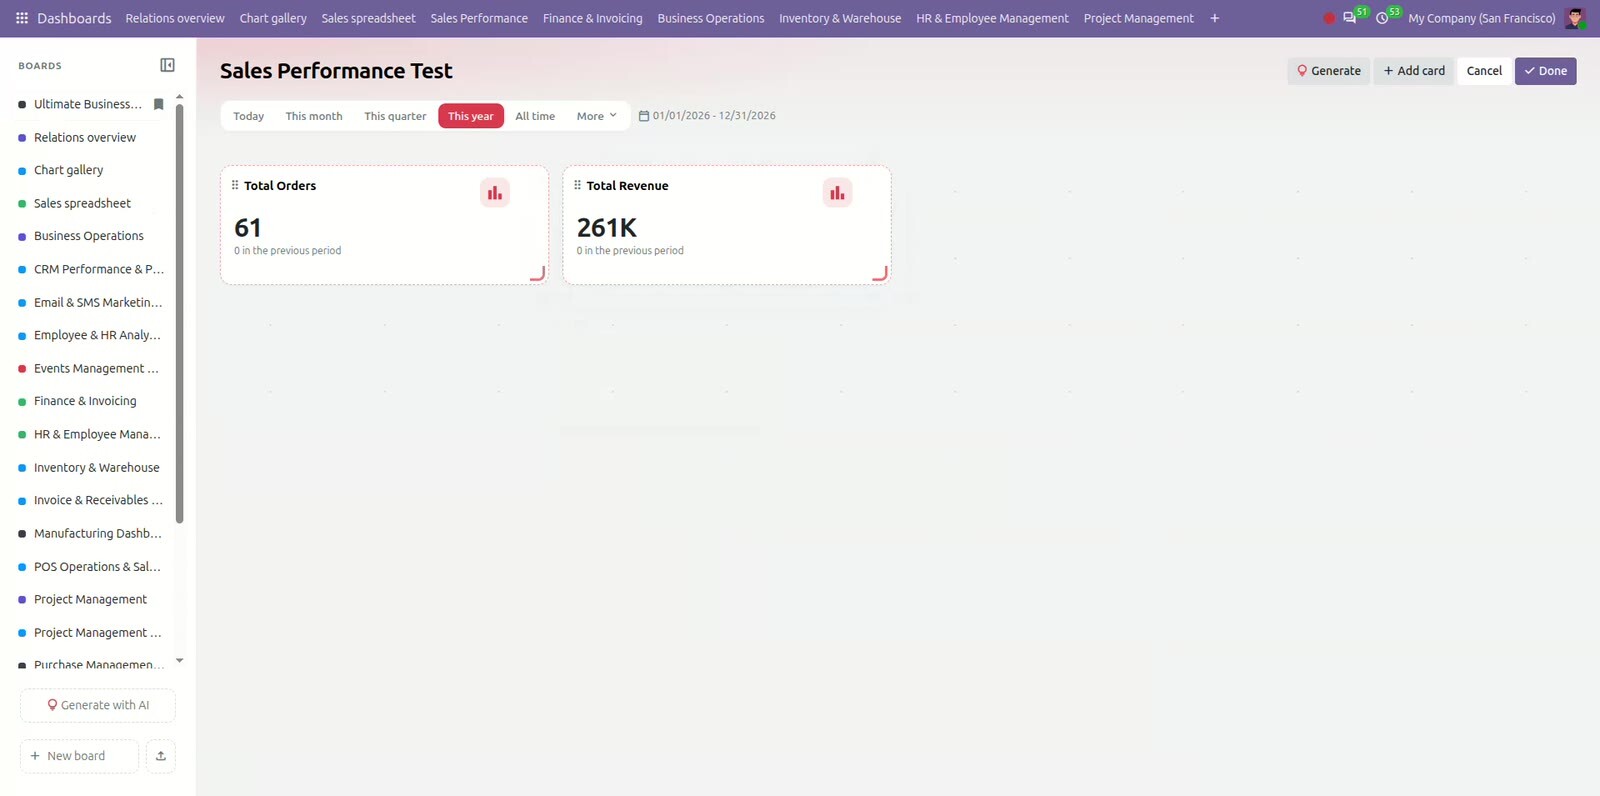
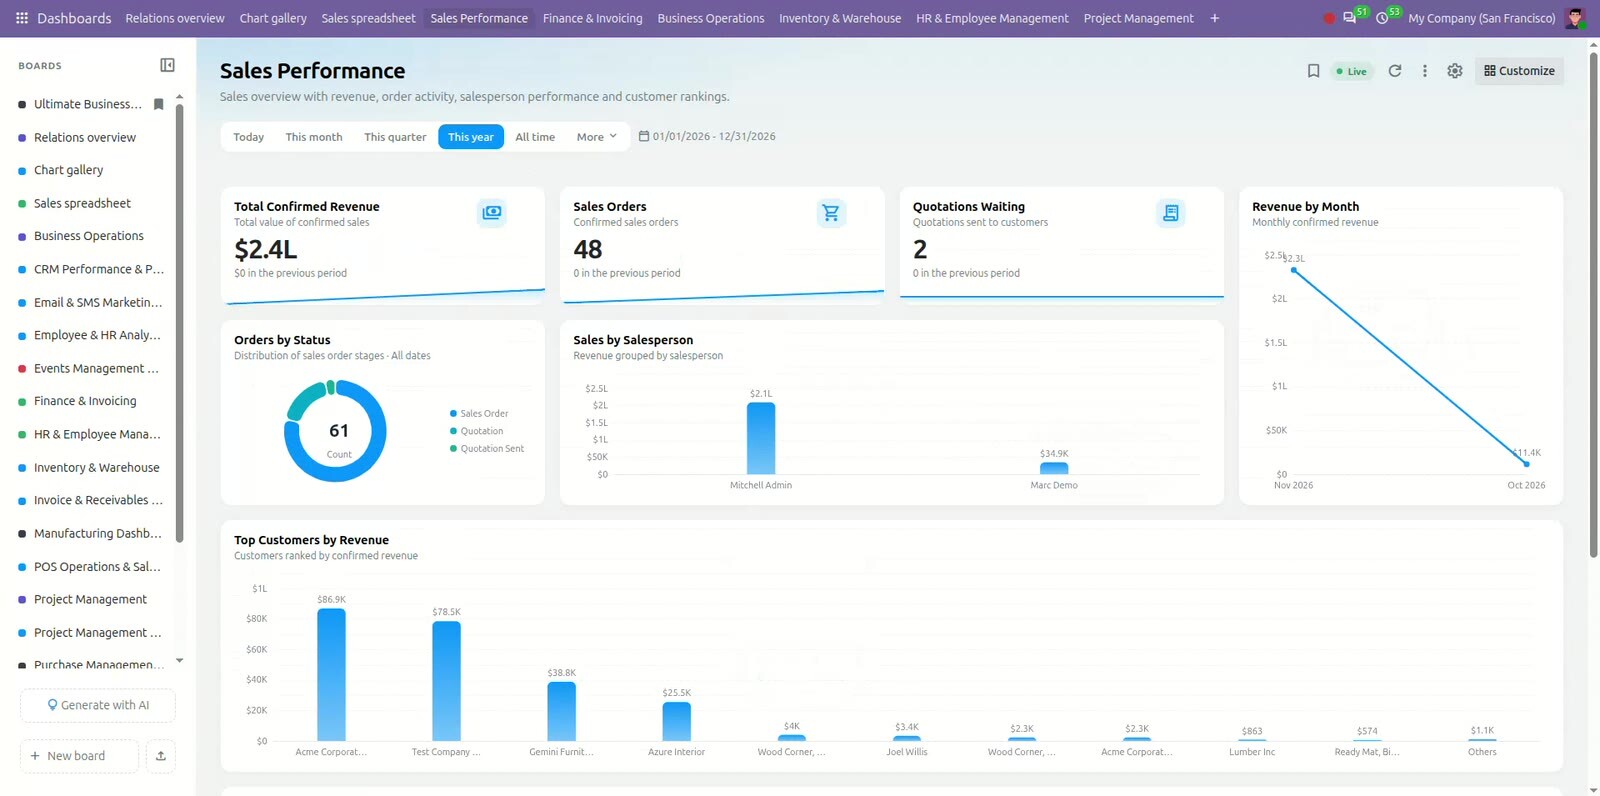
Creating executive dashboards no longer requires assembling queries manually. Pick any Odoo model (such as Sales Orders, CRM Leads, or Invoices), type a plain-language prompt describing the KPIs you want (for example, "monthly revenue, top customers, and quotations by salesperson"), choose your card count, and click Generate. The AI analyzes the model's schema and generates editable, interactive cards that you can reposition, restyle, or customize at any time.
2. Explain this chart
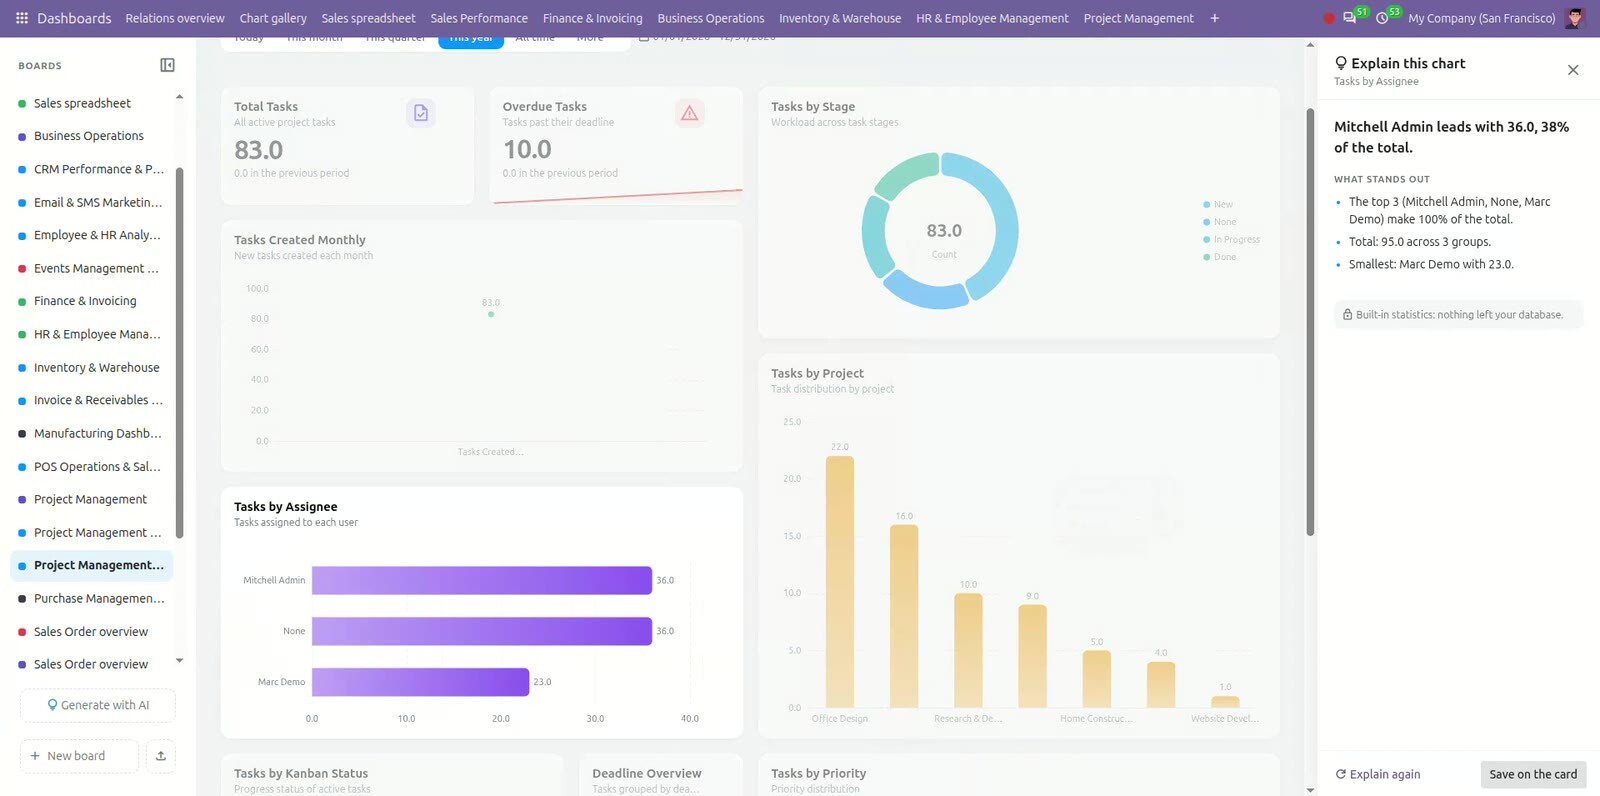
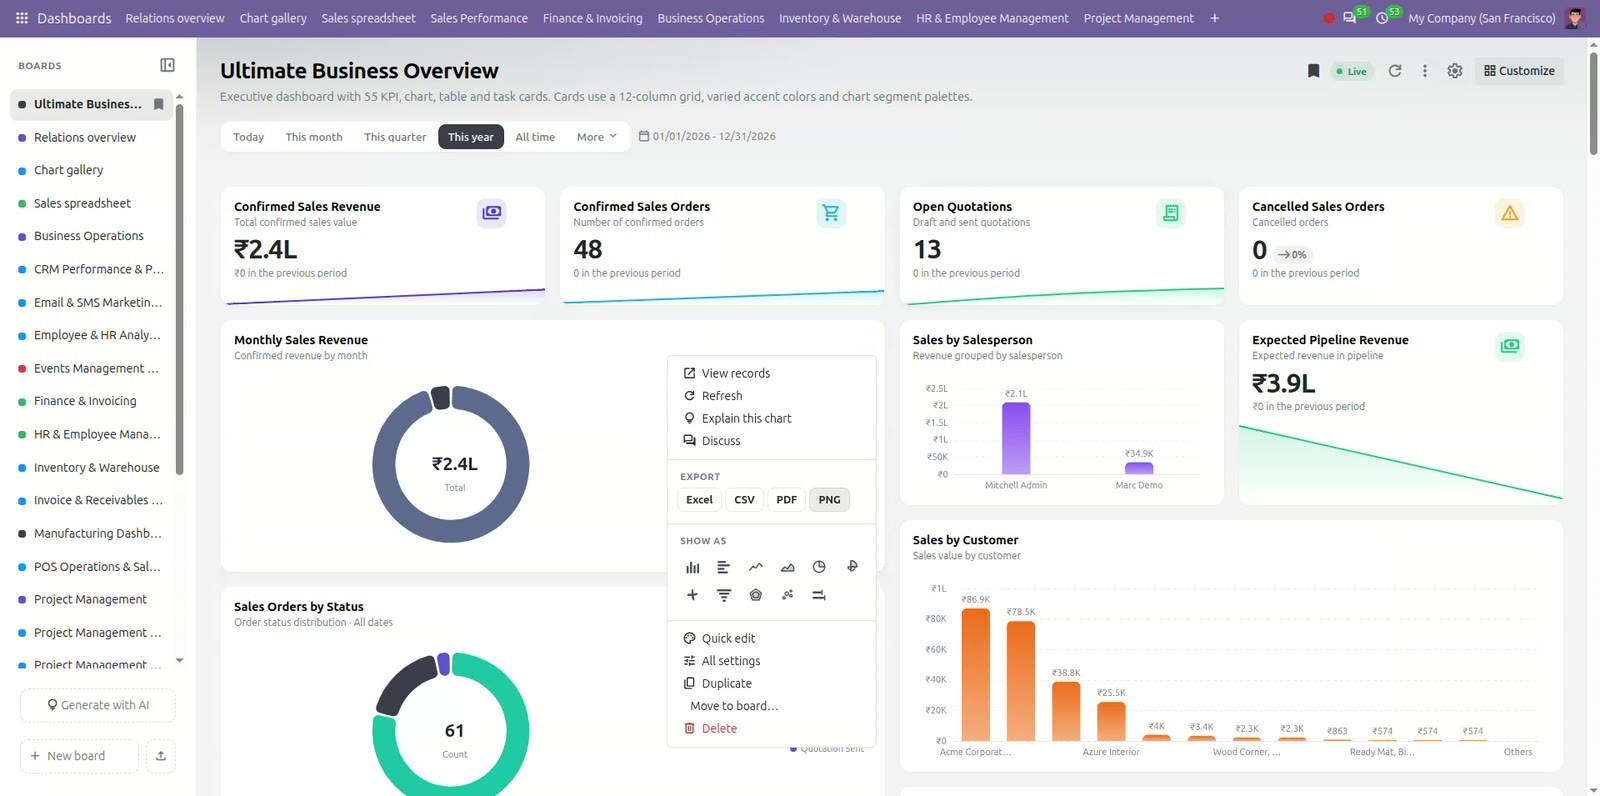
Every chart includes an "Explain this chart" button. With a single click, AI reviews the underlying aggregated numbers and generates a concise, readable breakdown: key takeaways, dominant contributors, growth trends, and statistical outliers. You can click Explain again for alternative perspectives or Save on the card so that every team member viewing the dashboard benefits from the curated takeaway.
3. Choose your AI provider, including offline
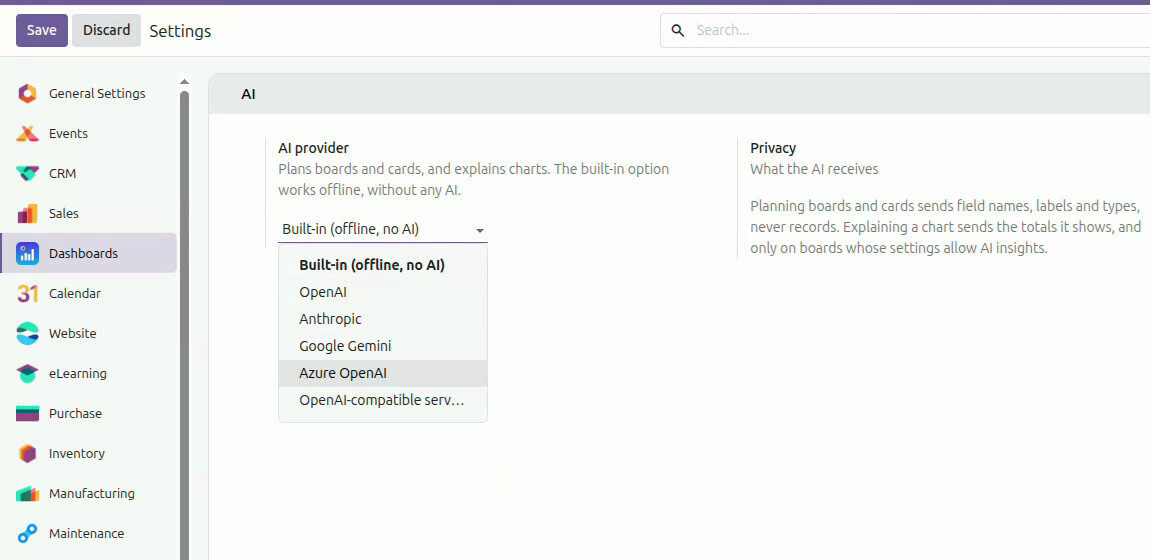
Cosmic Dashboard gives you total architectural freedom. Use the built-in offline engine that executes directly inside Odoo without requiring external API keys or incurring usage billing. Alternatively, connect OpenAI, Anthropic, Google Gemini, Azure OpenAI, or self-hosted LLMs using OpenAI-compatible endpoints.
4. 17 chart and card types
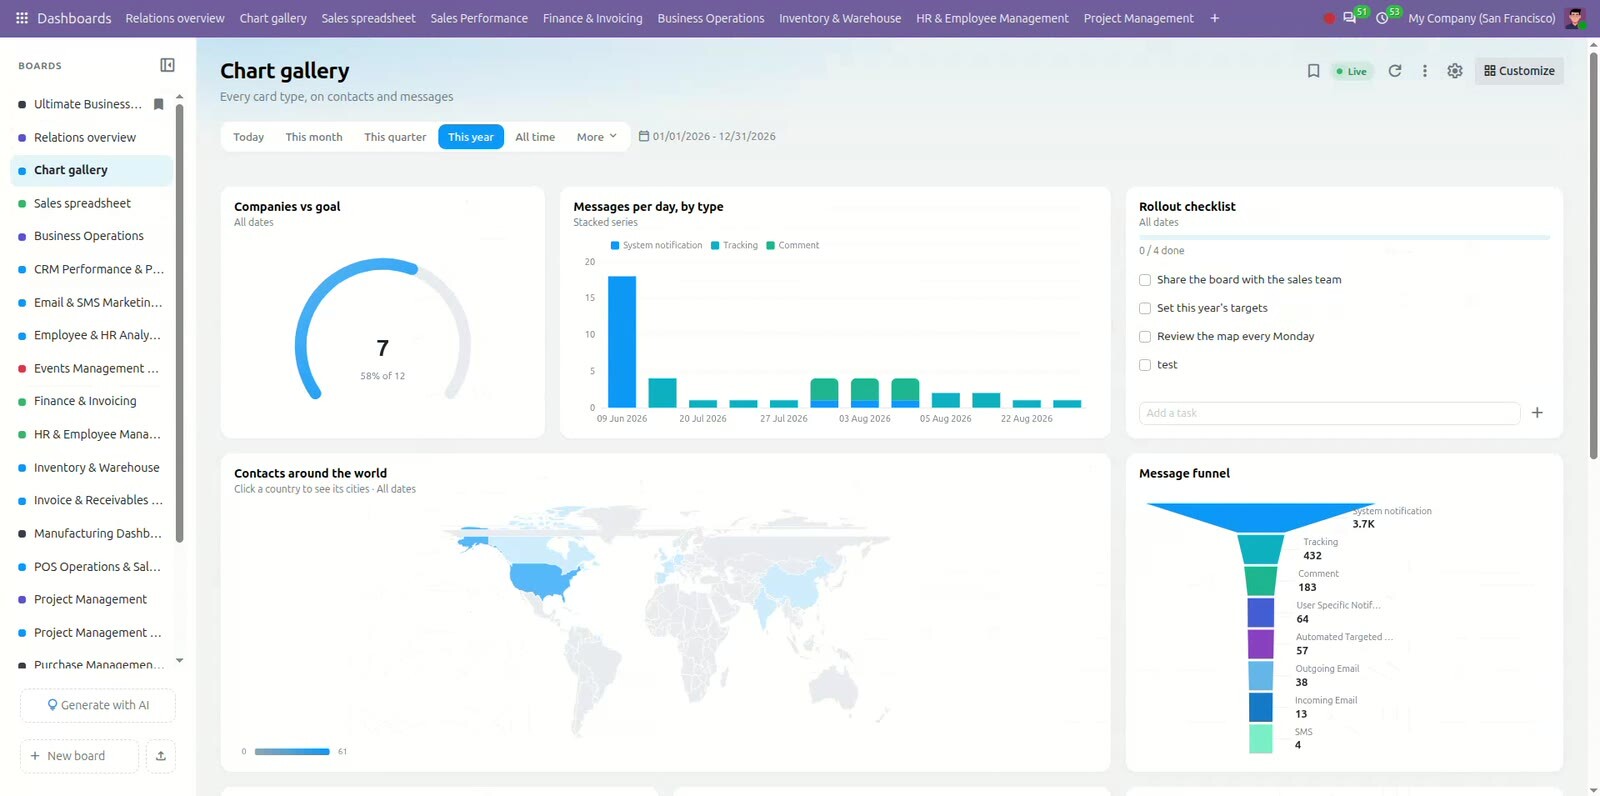
Present metrics exactly the way your stakeholders need them. Choose from 17 visualization types: KPI tile, column, horizontal bar, line, area, pie, doughnut, polar area, flower, funnel, radar, scatter, bullet, world map, gauge, data table, and interactive checklist. With the Show as selector, you can toggle between visualization formats instantly while preserving your configured filters, grouping, and styling.
5. KPI tiles with trends
KPI cards provide high-impact summary figures with automated comparison against the preceding period (e.g., this month vs last month). Each tile displays the exact percentage change, directional indicators, and an embedded sparkline trend. Values can be formatted in compact notation (1.2K, 3.4M), full decimals, or Indian currency standards (lakhs and crores).
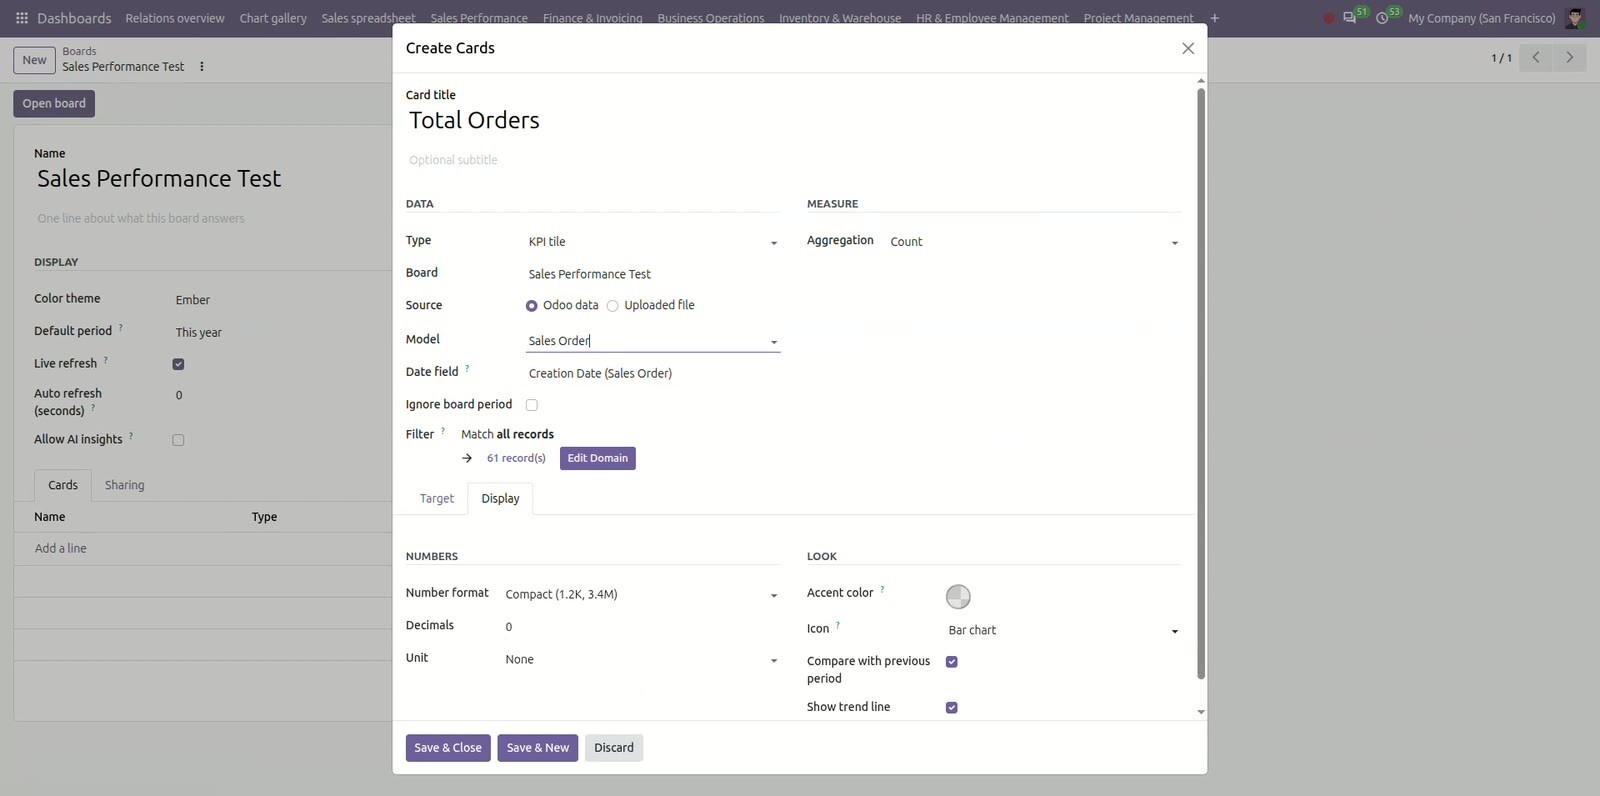
6. Group, split, drill down
Segment and inspect records with deep dimensional control. Group by a primary field, split series across a secondary attribute, and stack bars. Control group density by capping top results and consolidating remaining items into an automated "Others" bucket. Drill down by calendar intervals (day, week, month, quarter, or year), and click on any slice, bar, or marker to open matching Odoo records directly.
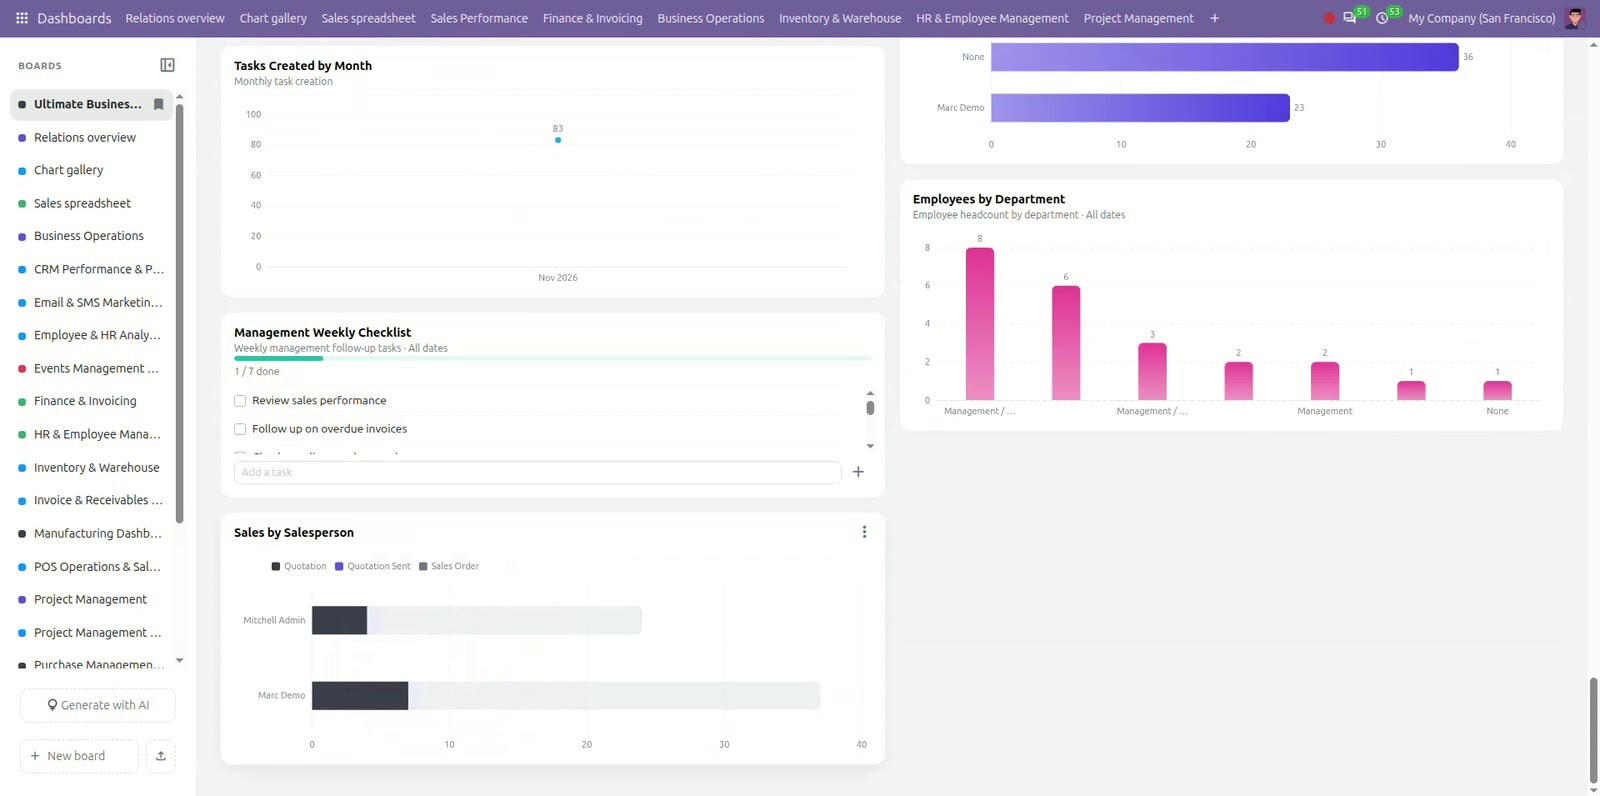
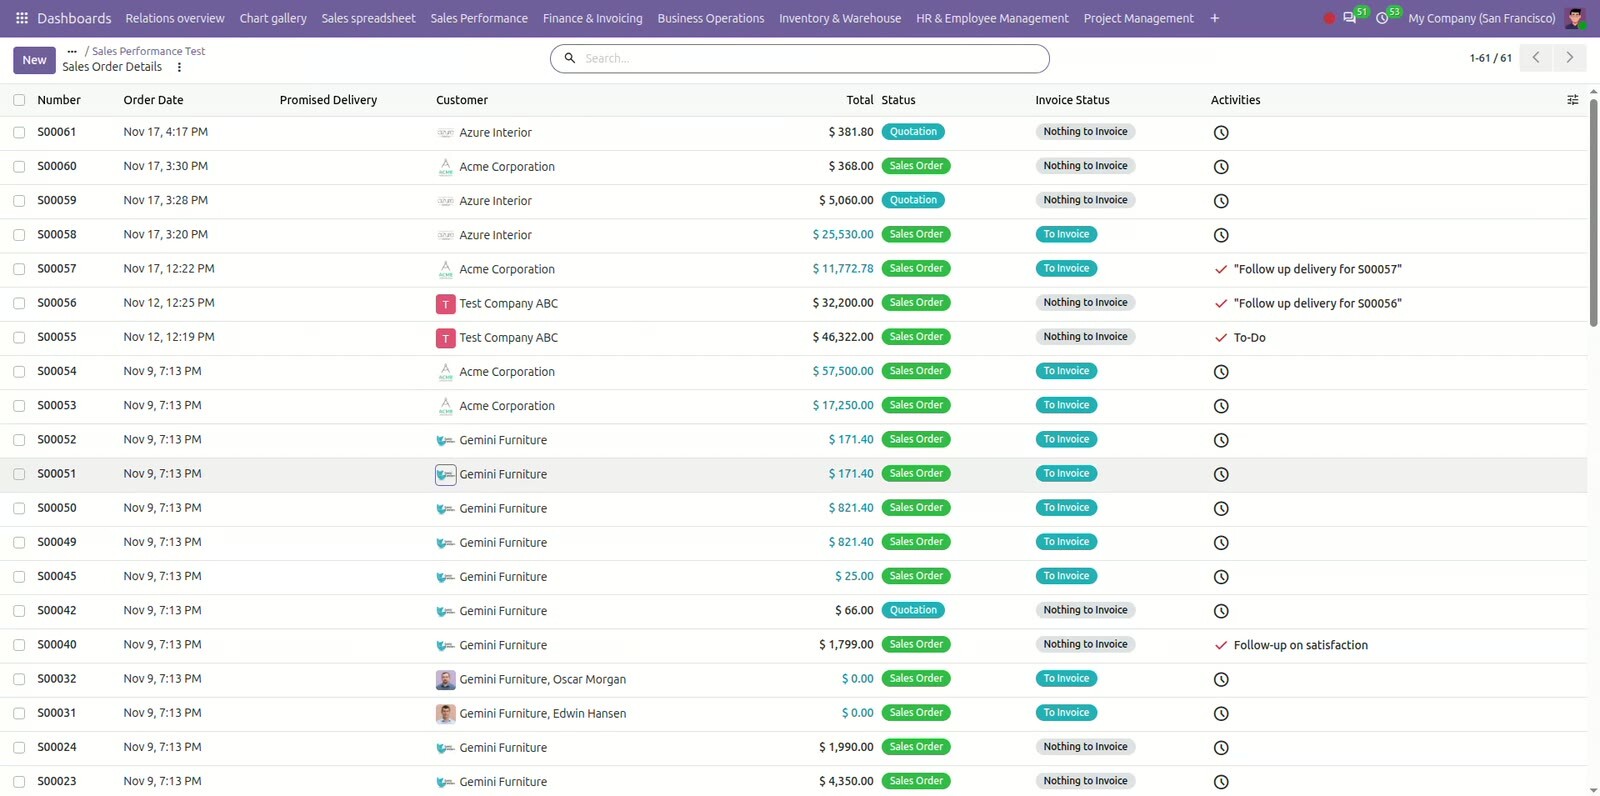
7. Date periods and dynamic filters
Filter data with more than 20 built-in presets: Today, Yesterday, This Week, This Month, This Quarter, This Year, Last 7/30/90/365 Days, Next 7/30 Days, or custom date ranges. Every board establishes a global default time window that viewers can override dynamically, while individual cards can enforce specific domain filters.
8. World map analytics
Visualize geographic distributions with an interactive choropleth world map. Link any country or territory field to track global sales distribution, international client locations, or regional fulfillment performance, complete with hover telemetry and one-click drill-down to country-specific records.
9. Drag, resize and style
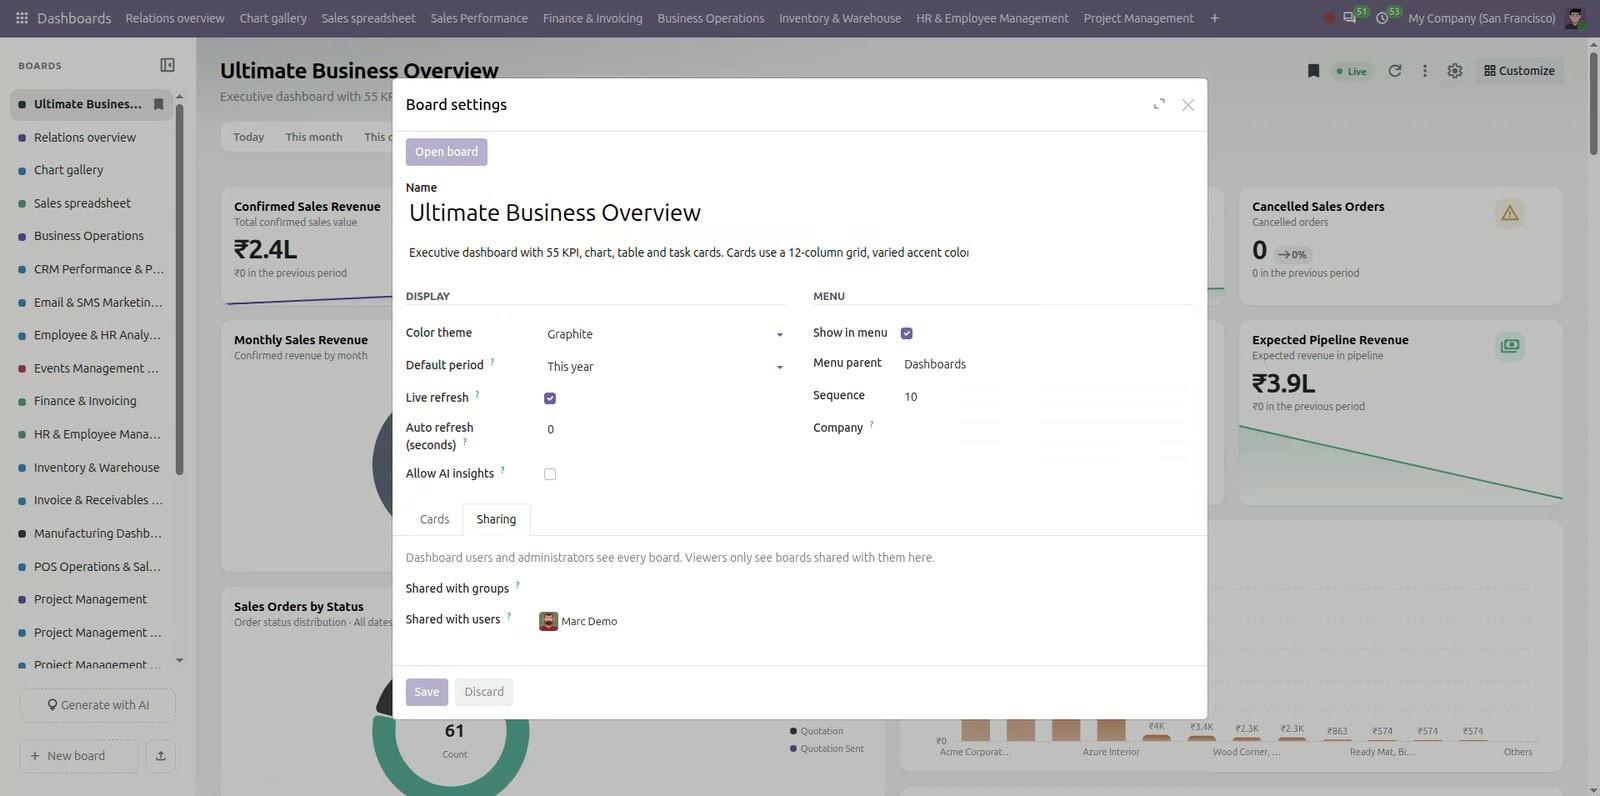
Design beautiful boards using a responsive 12-column grid canvas. Drag, reposition, and resize cards effortlessly; layout configurations persist automatically. Tailor visual aesthetics with preset modern palettes—including Aurora, Ember, Graphite, and Ocean—and utilize the live Quick Edit drawer to refine titles, colors, sort orders, and number formats.
10. Export and share
Distribute insights seamlessly across departments. Export individual cards to Excel (with native editable charts), CSV, PDF, or high-resolution PNG images. Export complete board layouts as JSON packages for migration between staging and production environments. Share boards with specific users or security groups, set a board as an employee's default login screen, and collaborate on cards inside dedicated Odoo Discuss channels.
11. Secure and multi-company
Granular access control ensures sensitive operational metrics remain secure. Assign user rights across four tiers (No Access, Viewer, User, Administrator). Cosmic Dashboard strictly honors standard Odoo record rules and multi-company boundaries, ensuring users only see the data their profile permits.
12. Mobile-ready
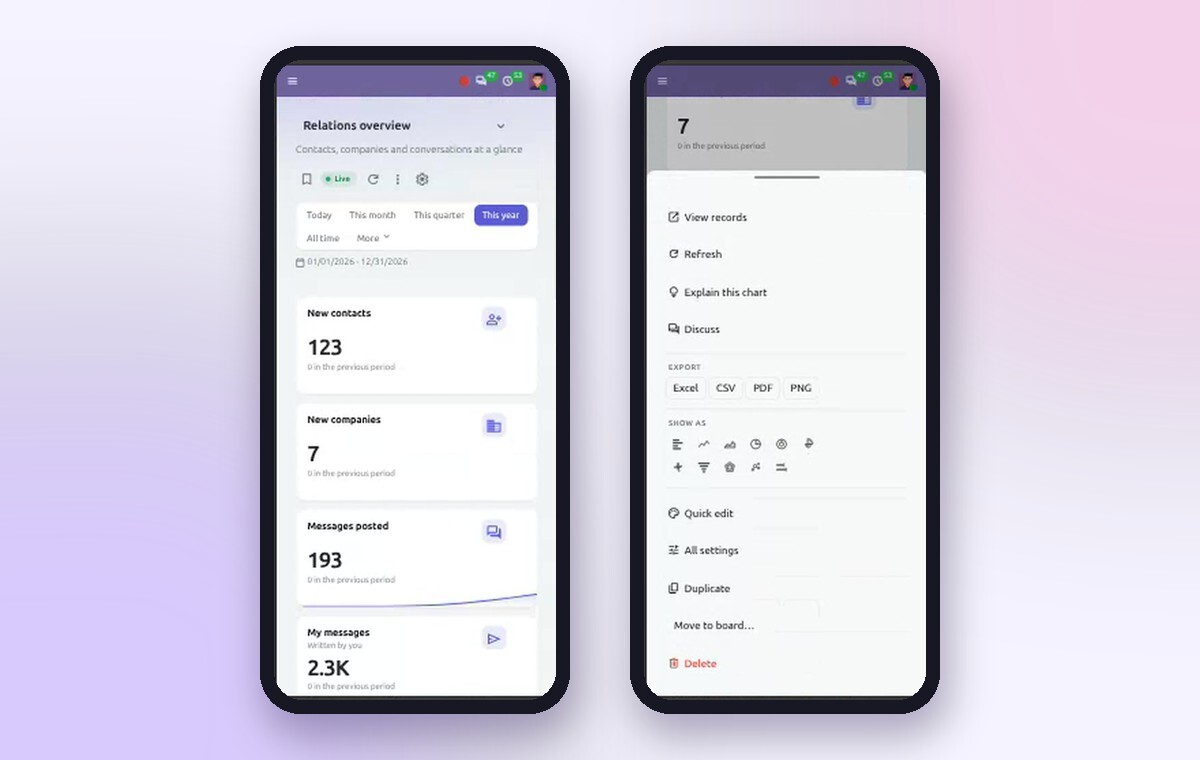
Monitor your enterprise on the go. Cosmic Dashboard is engineered for seamless responsiveness across smartphones, tablets, and desktop workstations. It operates natively inside mobile web browsers and the official Odoo mobile application, featuring an intuitive bottom-sheet action sheet for rapid mobile interactions.
How an AI dashboard works in Odoo
- Read live data: Every card queries your designated Odoo model (such as
sale.order,account.move, orhr.employee) using a date field, a domain filter, and an aggregation function (count, sum, average). Odoo's native security rules are strictly respected. - Plan with AI: When you use Generate with AI, the AI engine reviews the model's structural field definitions—without accessing private records—and constructs cards tailored to your prompt.
- Visualise: Results render across interactive charts, KPI metrics, tables, and maps on a responsive drag-and-drop grid, updating manually or via automated refresh timers.
- Explain: On authorized boards, Explain this chart submits aggregated metric summaries to your configured AI provider or offline engine, returning executive insights in plain English.
- Act: Click any chart segment, bar, or territory to open filtered Odoo records, initiate team discussions in Discuss, or export presentation-ready reports.
Odoo dashboard ideas by department
Every department across your enterprise can streamline operations with tailored KPI visualizations:
| Department | Recommended KPIs & Visualizations |
|---|---|
| Sales | Revenue this month vs last month, quotations by salesperson, top 10 clients, global sales distribution on world map |
| CRM | Opportunity pipeline value by stage (funnel), won vs lost deal ratio, lead generation source breakdown, upcoming scheduled activities |
| Accounting & Finance | Invoiced vs paid balances, overdue receivables aging, operational expenses by category, net cash in vs cash out |
| Inventory & Warehouse | Total inventory valuation, low-stock threshold alerts, on-time delivery rate vs late shipments, internal transfers by warehouse |
| Purchase & Procurement | Procurement spend by vendor, pending purchase orders, supplier fulfillment lead times, price variance analysis |
| Manufacturing (MRP) | Production orders by state, manufacturing output by product line, work-center capacity utilization and bottlenecks |
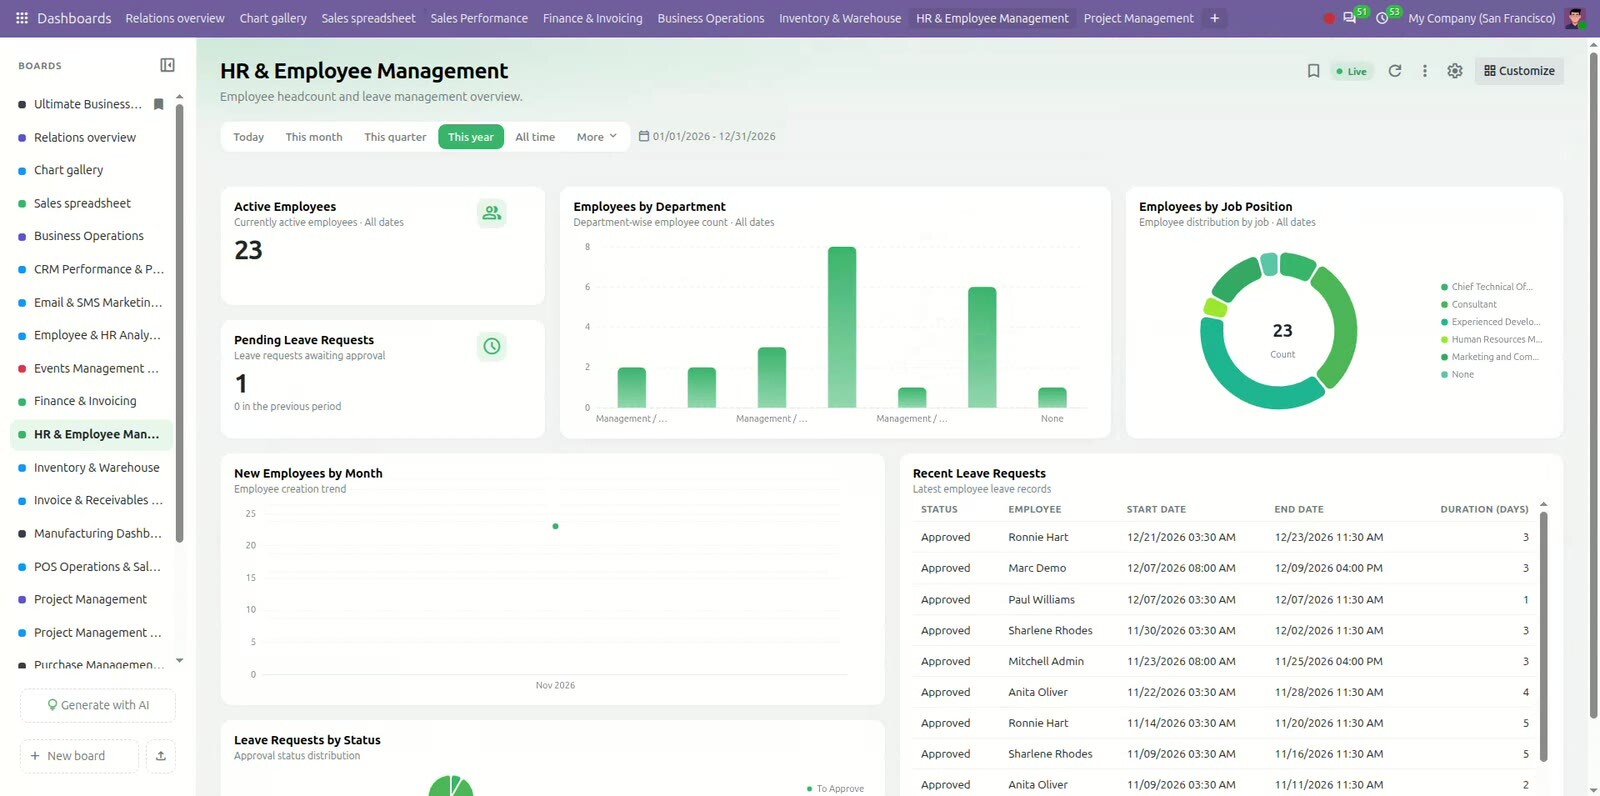
| Human Resources (HR) | Headcount by department, new hire onboarding progress, leave utilization rates, employee attendance trends |
| Project Management | Task completion status by milestone, overdue task counts, billable vs non-billable hours logged per project |
| POS & E-Commerce | Daily retail POS turnover, average basket value, online store transaction volume, top-performing product categories |
Odoo reporting vs external BI tools vs Cosmic Dashboard
Odoo's native reporting views are effective for single-model inspections, and Odoo Enterprise provides spreadsheet dashboards. Third-party BI tools like Power BI, Tableau, or Metabase deliver analytics but exist outside your ERP ecosystem. Cosmic Dashboard provides a modern BI analytics experience directly inside Odoo on Community and Enterprise alike.
| Feature / Capability | Odoo Built-in Reporting | External BI Tools | Cosmic Dashboard with AI |
|---|---|---|---|
| Runs directly inside Odoo | Yes | No (requires connector / ETL) | Yes |
| Live, real-time Odoo data | Yes | Depends on sync intervals | Yes (with auto-refresh) |
| Works on Odoo Community | Graph & pivot only | Yes (via API connector) | Yes (full functionality) |
| Multi-card drag & drop canvas | Limited (Enterprise only) | Yes | Yes (12-column responsive grid) |
| AI generates full dashboards | No | Paid add-ons / Co-pilot licenses | Yes (prompt to dashboard) |
| AI explains chart insights | No | Available on select tiers | Yes (one-click explanations) |
| Offline AI with zero API key | No | No | Yes (built-in offline engine) |
| Click-through to Odoo records | Yes | No | Yes (instant record drill-down) |
| Extra per-user licensing fees | No | Yes ($10–$30/user/mo) | No (one-time module purchase) |
Which should you choose? If your primary analytics workflows center around Odoo operational data and you want your teams to engage with metrics daily without context switching, an embedded AI dashboard inside Odoo offers the fastest time-to-value and highest adoption rate. If your enterprise requires consolidating dozens of non-Odoo data sources into a centralized corporate data lake, an external BI warehouse can operate alongside it.
How to build an AI dashboard in Odoo: step by step
- Install Cosmic Dashboard: Download and install the module from the Odoo Apps Store. A new top-level Dashboards menu appears immediately.
- Configure user access permissions: In Settings → Users & Companies, assign appropriate roles (Viewer, User, or Administrator) to team members.
- Select your AI provider: In module settings, retain the zero-cost built-in offline engine, or enter credentials for OpenAI, Anthropic, Google Gemini, Azure OpenAI, or a self-hosted endpoint.
- Create your first board: Click New Board to start with a blank grid, or click Generate with AI, choose an Odoo model, and describe the desired operational KPIs.
- Add and style visualization cards: Add KPI tiles, bar charts, funnels, gauges, or choropleth maps. Specify date fields, filters, and grouping dimensions, then use Quick Edit to fine-tune palettes and number formats.
- Organize your dashboard layout: Position cards on the responsive 12-column grid, establish the board's default calendar window, and configure automatic refresh frequencies.
- Share, collaborate, and export: Grant board visibility to individual users or groups, pin key dashboards as home screens, generate AI chart explanations on demand, and export presentation-grade reports.
Frequently asked questions
How do I create a dashboard in Odoo?
Install a dedicated dashboard module such as Cosmic Dashboard with AI, open the Dashboards menu, click New Board, and add KPI tiles or charts by selecting your target Odoo model, date field, and aggregation metric. Alternatively, click Generate with AI and describe your KPIs in plain English.
Is there an AI dashboard for Odoo?
Yes. Cosmic Dashboard with AI by Steigern Tech LLP automatically generates complete Odoo dashboards from natural language descriptions and delivers one-click plain-language explanations of charts, trends, and anomalies.
Does the AI see my business data?
When AI designs and plans a dashboard, it evaluates model field definitions and metadata only—your database records are never transmitted. For chart explanations, summaries are sent to an external provider only on boards where "Allow AI insights" is turned on, and the built-in offline engine makes no external network calls.
Do I need an OpenAI or other API key?
No. Cosmic Dashboard includes a native offline engine that operates directly inside Odoo without requiring third-party API keys or subscription fees. You can optionally connect external providers like OpenAI, Anthropic, Google Gemini, Azure OpenAI, or self-hosted models.
Does it work on Odoo Community?
Yes. The module provides full feature parity across Odoo Community and Odoo Enterprise, running smoothly on Odoo Online, Odoo.sh, and On-Premise hosting.
Can I use it as an Odoo BI tool?
Yes. With 17 visualization types, multi-dimensional grouping, split series, interactive drill-down, historical comparisons, choropleth world maps, and multi-format exports, it fulfills virtually all enterprise business intelligence requirements inside Odoo.
Is the dashboard data real-time?
Yes. Cards execute live ORM queries against your Odoo database, supporting both on-demand manual refreshes and automated interval refreshes.
Can I export Odoo dashboard charts to Excel or PDF?
Yes. Any card can be exported to Excel (with a native editable chart), CSV, PDF, or high-resolution PNG image.
Can I share dashboards with specific users?
Yes. Boards can be shared with specific Odoo users or security groups, governed by Viewer, User, and Administrator permission tiers, and configured as default user landing pages.
Does it work on mobile?
Yes. Dashboards are responsive across smartphones, tablets, and desktop displays, operating seamlessly in mobile web browsers and the official Odoo mobile app.
Get Cosmic Dashboard with AI
Transform raw ERP data into actionable executive intelligence that drives business performance. Cosmic Dashboard with AI by Steigern Tech LLP is available now on the official Odoo Apps Store.
Need custom board architecture, enterprise AI models, or turnkey Odoo implementation? Consult the engineering team behind the module:
- WhatsApp: +91 94275 72571
- Email: [email protected]
- Website: steigerntech.com
- Office: 312, Arista Business Space, Sindhu Bhavan Marg, Bodakdev, Ahmedabad, Gujarat 380059, India
Comprehensive Odoo Engineering Services
Beyond executive dashboards, Steigern Tech provides end-to-end Odoo ERP development services: turnkey implementations, custom module architecture, legacy data migrations, third-party integrations, and 24/7 SLA maintenance for global businesses.
Explore our Odoo services →Sources
Related Engineering Insights
Odoo Workflow Automation: an n8n-Style Visual Workflow Builder Inside Odoo
Automate Odoo with a drag-and-drop, n8n-style workflow builder: triggers, If/Else, approvals, emails, webhooks and logs. By Steigern Tech LLP on Odoo Apps.
Xero Odoo Connector: Sync Odoo with Xero via the Xero REST API
Sync Odoo with Xero using the Xero REST API. Contacts, products, invoices, bills and payments for Odoo 16–19. By Steigern Tech LLP, on Odoo Apps.
IoT and AI in Agriculture: How Smart Farming Helps Farmers Grow More
Learn how IoT sensors and AI help farmers save water, cut costs and grow better crops, with real data, 8 use cases and a Contra Farms case study.
Ready to engineer your system with production discipline? Talk to our lead architects.
Our senior engineers review your requirements, design the technical roadmap, and deploy dedicated squads tailored to your tech stack.